From the patient field guide
Tirzepatide in SURMOUNT: how much can two estimates settle?
A scientific reading companion on precision, meaningful differences and the limits of a plotted average.
Clinician medical review has not been completed.
Start with the question
SURMOUNT-1 randomized adults with obesity or overweight without diabetes to weekly subcutaneous tirzepatide or placebo; the primary treatment period lasted 72 weeks.[1]
One nausea/vomiting/diarrhea report defined a nonrandomized symptom subgroup.[2]
Three questions organize a useful reading of a comparison. Where is the estimated average? How uncertain is the difference between averages? How large a difference would alter the judgment being made? These questions belong together, but none can substitute for the others. Locating a mark on an axis answers the first. The second concerns how securely the comparison has been estimated. The third requires an explanation of why a particular separation would matter, rather than an impression that two marks look close.
Before interpreting a comparison, write its intended claim as a sentence. Describing an association between categories asks what accompanies membership in those categories. Claiming that changing membership would change an outcome asks about an intervention. The latter requires a reason to treat the change in membership as the cause of the outcome change. A category name cannot supply that reason. This distinction applies even when the categories are easy to recognize and the outcome has been measured carefully.
The central task is therefore to keep the conclusion attached to the question that produced it. A claim about an average needs a defined set of observations and a scale. A claim about a difference additionally needs a comparison and its uncertainty. A claim about practical similarity needs a defensible standard of relevance. Begin with this sequence before choosing an adjective such as close, precise or meaningful; each adjective otherwise leaves its reference point unstated.
Two locations on a scale
The paper’s Figure 1 reports least-squares means; its error bars represent standard errors.[2]
A plotted point supplies a coordinate. Its meaning depends on the quantity named by the axis, the unit used and the reference from which change is measured. Moving farther along an axis can indicate a larger numerical value without indicating a better outcome. Likewise, a negative sign describes direction relative to a reference; it does not describe evidential strength. Reading the labels is part of interpreting the measurement, because the same geometry can represent quite different quantities.
The distance between two marks also depends on the drawing. Stretching an axis makes a fixed numerical separation look wider; compressing it makes that separation look narrower. Neither operation changes the estimates. A visual impression of proximity is therefore unstable under a harmless redesign. Any conclusion that is supposed to survive a change in chart width must ultimately refer to the measured scale. The graphic can direct attention to a comparison, but the available space on a screen cannot determine its importance.
An average is already a reduction of information before it becomes a point. Different collections of observations can share an average, so the coordinate cannot uniquely recover the collection that generated it. Printing more decimal places does not reverse that reduction. Additional digits refine how a number is displayed; additional evidence concerns how well the quantity is known. Those operations should remain separate when deciding what to request next. If the question is about the comparison's precision, a more detailed account of uncertainty is useful in a way that a larger image of the same point cannot be.
Reading the estimates
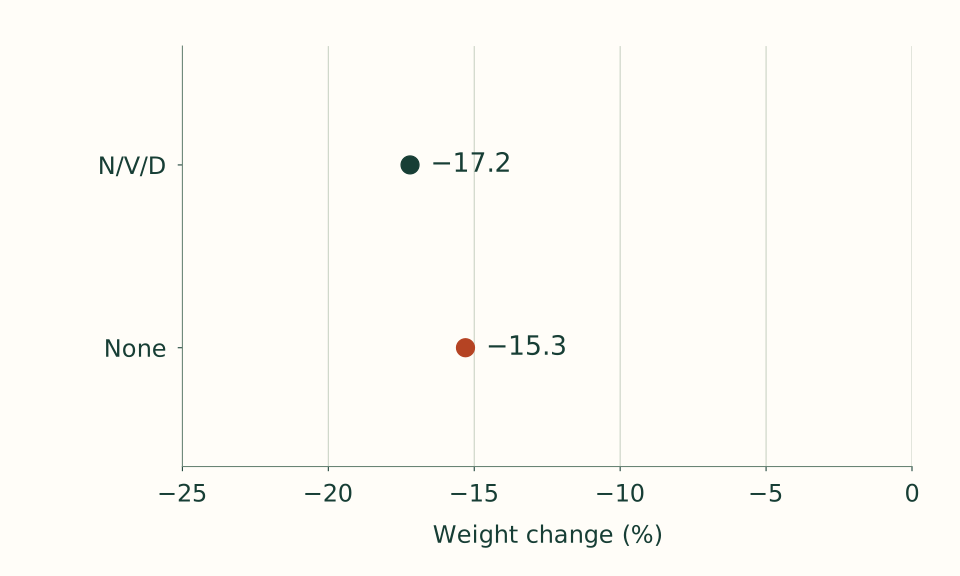
Open the chart’s data table
| Group | Weight change (%) |
|---|---|
| N/V/D | −17.2 |
| None | −15.3 |
Precision needs a target
ICH recommends confidence intervals alongside effect estimates whenever possible.[3]
Precision needs a noun after it: precision of what? The location of each average and the separation between averages are different quantities. Imagine that an uncertain influence moves both estimates together. Their locations may change while their separation changes little. If instead the uncertain influence pushes them in opposite directions, the separation can change substantially. Thus, uncertainty in a contrast depends on how the estimates move together, as well as on uncertainty attached to each estimate considered alone.
This is why a comparison cannot be reduced to looking at two individual uncertainty displays and judging their appearance. The relevant calculation must follow the quantity being compared. Shared information can produce related estimation errors, and that relationship matters when one estimate is subtracted from another. The term covariance names this joint behavior. Naming it does not provide its value; it identifies a feature that a method for estimating the contrast must handle. A reader should not silently replace that feature with an assumption that the estimates are independent. The interval also needs a stated construction and interpretation. Without those, identical endpoints could conceal different reasoning, leaving the reader unsure what kind of uncertainty the display is intended to summarize.
Another distinction concerns the object that varies. An uncertainty interval for a mean addresses estimation of that mean under stated assumptions. A spread of individual observations describes variation among observations. These are not interchangeable just because both may be drawn with lines extending around a central mark. To decide what a line can support, ask what would vary in the reasoning behind it: the estimate across hypothetical repetitions, or the outcomes across people. A clear answer prevents an apparently precise average from being treated as a narrow range of personal outcomes. It also prevents individual variation from being misread as proof that an average cannot be estimated usefully.
How much would matter?
Equivalence requires a justified margin; a nonsignificant difference alone is insufficient.[3]
A meaningful margin expresses a judgment about consequences on a particular scale. Its justification should explain what decision would change if the true difference moved beyond that boundary. Without that connection, a margin is simply another number. A percentage, a duration and a symptom score would require different explanations because they describe different outcomes. Even a shared unit would not automatically make one boundary appropriate for every purpose. The time horizon and the consequence being judged belong in the explanation. If consequences differ by direction, the justification should address that asymmetry instead of assuming that equal numerical distances carry equal importance.
There is a circular way to choose a boundary: inspect the observed separation, draw a permissive boundary around it, then announce that the result fits. The apparent reassurance comes from how the rule was chosen. An independently justified boundary breaks that circle by allowing an inconvenient result to remain inconvenient. This does not require pretending that judgments about importance are value free. It requires making the values and consequences explicit enough that another reader can disagree with them without disputing the arithmetic.
Consider the logical roles of location, uncertainty and a boundary. A location can fall inside a region while substantial uncertainty extends outside it. A wide uncertainty range can accommodate both small and consequential differences. Neither situation is resolved by selecting a softer adjective for the location. Conversely, a carefully justified boundary is not made unnecessary by precise estimation: knowing a difference well still leaves the question of whether it matters. The strongest conclusion is the one supported jointly by the measurement and the decision rule. Where those elements do not resolve the question, a useful report identifies what remains unresolved instead of treating uncertainty as evidence for whichever conclusion feels more reassuring. That preserves a distinction between inadequate resolution and a demonstrated practical judgment.
The average and the person
An average and an individual outcome answer questions at different levels. As a mathematical possibility, observations can move away from an average in opposing directions while leaving the average unchanged. Knowing the center would then tell us nothing about the size of those opposing movements. This is a statement about what aggregation permits, not a description of any particular set of participants. It explains why a stable central estimate cannot, by itself, establish that individuals will cluster tightly around it.
A personal forecast also has to specify whose future outcome is being forecast and what information is available at the time of the forecast. Information discovered afterward cannot fairly be treated as information a person could have used beforehand. Otherwise, a prediction exercise becomes an explanation assembled with hindsight. Separating those tasks matters even if the retrospective explanation is coherent. A useful forecast must be evaluated using the information that would actually exist when someone had to rely on it. There is also a difference between predicting the outcome that will occur and explaining why it will occur. Predictive accuracy alone would not identify a cause.
To assess such a forecast, one would need evidence about its performance beyond the observations used to construct it. Relevant questions include whether stated ranges contain outcomes as often as promised and whether systematic errors appear in the setting where the forecast would be used. Those are questions about predictive performance, rather than the precision of a reported mean. More detailed categories do not automatically solve them: increasingly specific labels can give an impression of personalization without demonstrated predictive accuracy. The appropriate response to an average is therefore neither to dismiss it nor to turn it into a promise. Use it for the population question it addresses, while asking separately what evidence would support a forecast for a person.
What records contribute?
Analyses excluded data after study-drug discontinuation.[2]
The definition of an analysis determines which records can contribute to its answer. A measurement can exist without belonging to that analysis, just as an eligible measurement can be unavailable. These situations raise different questions. In the first, the reader needs the reason for excluding an existing record. In the second, the reader needs an account of how unavailable information is handled. Treating both situations as a vague problem with incomplete data obscures the rule that would have to change.
Precision is conditional on that rule. Two analysts might perform equally careful calculations while answering different questions because they include different periods of observation. Better arithmetic cannot decide which period matches the reader's purpose. That choice requires an explicit description of the desired outcome and when it is to be assessed. A narrow uncertainty interval can be informative within its defined scope while leaving an outside question untouched. The boundary of the question remains consequential even when the calculation inside it is exact.
A useful reading exercise is to state what one would learn from a record that lies outside an analysis rule, without assuming that the record must therefore be included. Would it extend the time horizon, describe a different circumstance, or answer a different question altogether? This makes the tradeoff inspectable without asserting that any particular exclusion causes bias. It also separates a request for additional analysis from an accusation that the reported calculation is wrong. The companion analysis offers another place to practice keeping definitions attached to the quantity being interpreted. Comparing the questions being asked is useful; treating answers to different questions as interchangeable is not.
Check a claim for stability
One way to examine a conclusion is to construct a table of conditional statements: if a specified assumption is adopted, this conclusion follows; if another defensible assumption is adopted, this is what changes. Start by writing the conclusion precisely enough that a change would be recognizable. Saying that a result remains encouraging is too elastic. Saying that a conclusion crosses a previously justified boundary, or becomes too uncertain to resolve that boundary, identifies a concrete difference in interpretation.
The table should distinguish a change in the answer's uncertainty from a change in the question itself. An interval that widens while the target stays fixed changes how much the analysis resolves. A calculation that switches the population or period being described may instead concern a different target. These changes can both be informative, but presenting them as the same kind of check hides their meaning. The reader needs to know which premise changed before interpreting a stable or unstable conclusion.
Such an exercise tests dependence on assumptions; it does not create new observations or reassign participants. Repeating calculations cannot manufacture the protections that a different study design would provide. Nor does a collection of similar results prove that all important alternatives have been considered. The useful product is a map of dependence: which choices matter to the stated conclusion, which appear immaterial within the examined range, and which remain unexamined. Recording the reason for each proposed alternative makes that map easier to challenge. Selecting alternatives only because they preserve a preferred conclusion would defeat the purpose of checking how the conclusion depends on its premises.
A checkable conclusion
Lilly-funded; six authors disclosed Lilly employment and shareholding.[2]
A checkable conclusion has a chain of support. The target names what is being estimated; the membership rule identifies which observations contribute; the uncertainty statement describes the estimate's resolution; the meaningful margin connects the measurement to a judgment. These elements serve different functions. Omitting one leaves a specific gap that another cannot repair. A detailed description of membership, for example, cannot supply a justification for practical importance, while an attractive decision rule cannot explain which records entered the calculation.
Disclosures add another kind of information. They identify relationships relevant to scrutiny, but do not mechanically determine whether an estimate is correct. To examine a scientific claim, a reader still needs to inspect the choices that connect observations to conclusions. Neither dismissing a result because of a relationship nor endorsing it because that relationship was disclosed performs that examination. The research method is a separate account of editorial practice; it does not replace the methods supporting a particular calculation.
The reporting request can therefore be specific: name the quantity, show how uncertainty was obtained, explain the decision boundary and make the contributing records identifiable by rule. With those pieces, disagreement can be located. Readers can determine whether they dispute a calculation, an assumption or a judgment about consequences, and request the information that would address that particular dispute.
Current safety and reading scope
Zepbound is contraindicated with personal or family medullary thyroid carcinoma history, multiple endocrine neoplasia type 2, or prior serious hypersensitivity to tirzepatide or product ingredients. Use is not recommended with severe gastroparesis. Persistent or severe abdominal pain needs prompt assessment; gastrointestinal fluid loss can injure kidneys. Gastric emptying is delayed.[4]
Compounded GLP-1 products are not FDA-approved.[5]
Keep two reading tasks separate: understanding what evidence establishes and deciding what care is appropriate for a particular person. A statistical interpretation cannot complete an individual assessment. The reference entry provides another route into the library; its role is orientation, not a personalized conclusion.
A provider review invites checking dated provider documentation and asking service questions. Linking it here does not turn the scientific comparison into an evaluation of that service. When moving between these pages, retain the question each page is meant to answer instead of carrying an impression of scientific certainty into a different decision.
Reader questions
Can two nearby estimates establish equivalence?
Closeness is a description of locations, whereas an equivalence conclusion needs uncertainty assessed against a justified boundary. Changing the scale of a drawing can change the appearance of closeness without changing the evidence. The useful question is whether the uncertainty about the comparison permits a consequential difference under the stated decision rule. A visual impression cannot resolve that question, and a boundary chosen merely to accommodate the result cannot independently justify the judgment.
Does a precise mean predict an individual result?
No. Precision concerns how well the mean is estimated; individual prediction concerns a future outcome for a person. Opposing deviations can leave an average unchanged, so knowledge of the center does not determine the spread around it. A credible personal forecast would require an appropriate prediction method and evidence of its performance in the intended setting. A more precise estimate of the center does not supply that evidence by itself.
What should an uncertainty report make explicit?
It should identify the quantity being estimated, the records that qualify, the assumptions used and what the reported interval represents. Each item removes a different ambiguity: the target defines the question, membership defines the contributing information, assumptions connect that information to the estimate, and the interval describes uncertainty on that basis. A separate explanation of practical importance is then needed to turn the estimate into a judgment about consequences.
Assessment
A useful scientific conclusion preserves the distinctions that made its evidence interpretable. Locating an estimate, assessing the uncertainty of a comparison and judging a meaningful difference are connected tasks with different requirements. Confidence in one cannot be borrowed to complete another. The same discipline applies when moving from an average to an individual forecast, or from records admitted by a rule to circumstances outside that rule. A well-specified report makes these transitions visible. It allows a reader to identify exactly which additional information could narrow the conclusion, which assumption would need examination and which judgment about importance remains open to disagreement. That is a more useful form of resolution than attaching a confident adjective to a plotted point. It can support a limited conclusion without implying personal certainty, and it can identify unresolved questions without treating the entire analysis as uninformative.
Reading scope
This reading companion examines the logic of estimates, uncertainty and interpretation. It does not calculate an additional comparison, set a clinical equivalence margin or provide a personal outcome forecast. Its methodological examples are conditional explanations, not additional findings about participants. Individual treatment decisions require a separate clinical assessment.